Let's Talk
If you have a role or opportunity that sounds like a good fit, I'd love to hear from you. — Chris
Connections Academy Schools are tuition-free K-12 virtual schools—offered in 29 states serving more than 100,000 students throughout the United States. A division of Pearson Education.
A School leader is responsible for their school's academic and operational success. Therefore, they need real-time access to performance and operational data to operate successfully.
We used a design workshop (based on Design Sprints) to facilitate the process. The workshop included problem statement definition, qualitative user interviews, customer journey mapping, team sketching, high fidelity prototype, and testing.
School leaders are responsible for the academic and operational success of their Connections Academy virtual school. They spend a lot of time looking for and accessing specific data points needed to track teacher and student performance. Our role was to ideate on solutions to give school leaders (and staff) a way to quickly and easily access the data needed throughout the school year cycle.
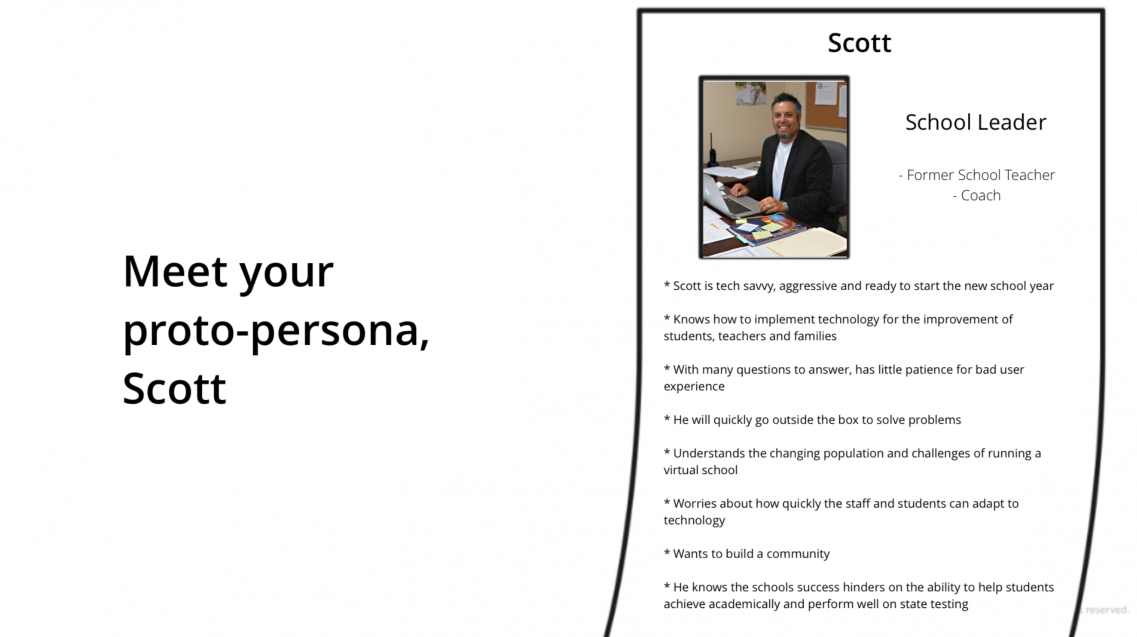
Our primary persona was school leaders. They know how to implement technology to better teachers, students, and families—they have many responsibilities and little patience for bad integrations.
As the UX Design Lead, my role was to help the product manager plan, facilitate, and deliver the design workshop (problem statement, qualitative user interviews, customer journey mapping, team sketching, high fidelity prototype, and testing). Then from our discovery sessions, design a solution.
Our timeline was to complete our solution recommendations before the next PI Planning (SAFe - Scaled Agile Framework).
We were working within the constraints of an existing legacy learning management platform where all academic and performance data exists while adhering to architecture and performance guidelines.
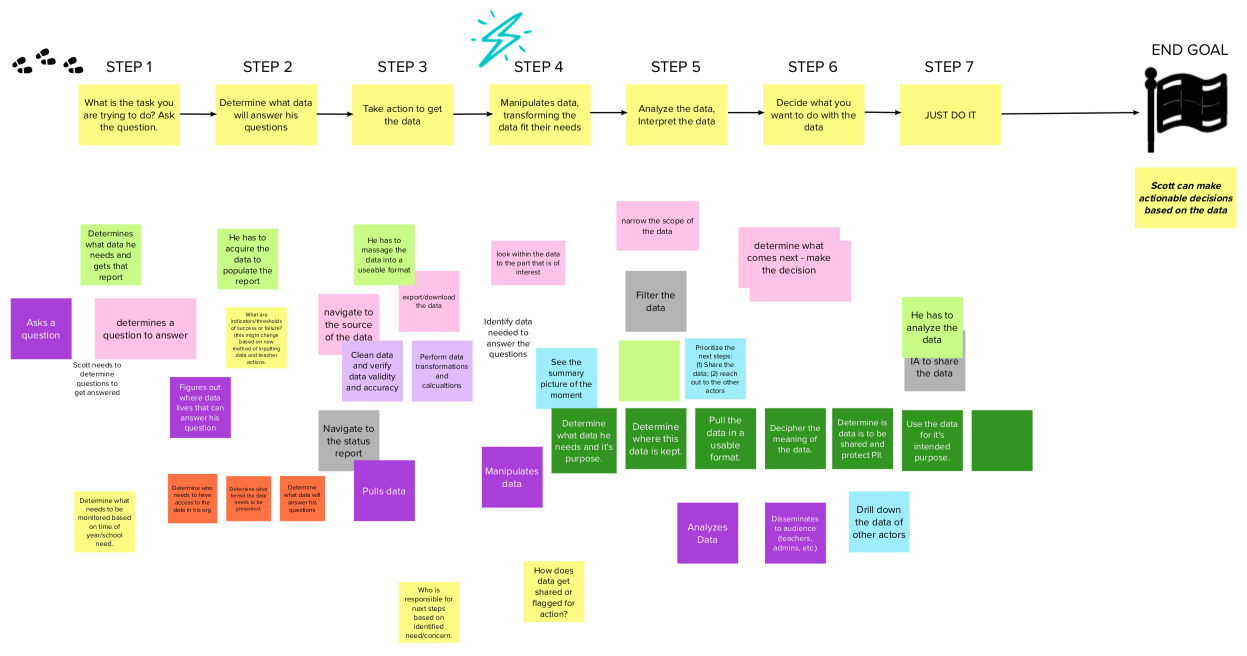
Design Workshop: I partnered with a product manager to run a discovery workshop (based on design sprint) with various stakeholders within the company. The workshop's goal was first to identify the problem by talking to school leaders and then ideate on possible solutions.
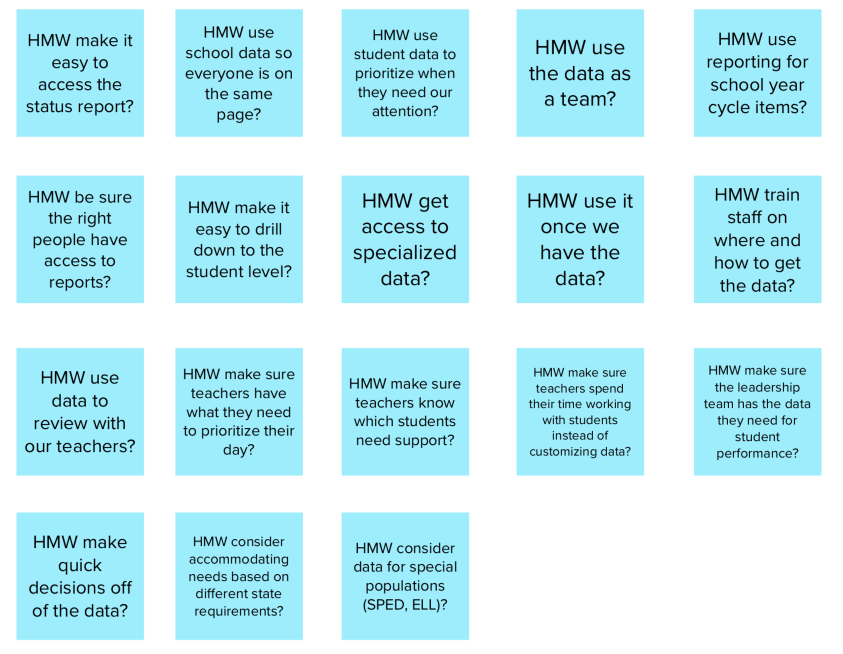
We used various design thinking methods (qualitative interviews, HMW, user journey mapping) to help us identify how school leaders were using academic data to make informed decisions.
The participants in the design workshop consisted of stakeholders across the organization (UX, Architecture, Product Management, School Support Staff, Business Owner). Each team member created a low-fidelity sketch/wireframe of their solution based on school leader interviews and the customer journey map.
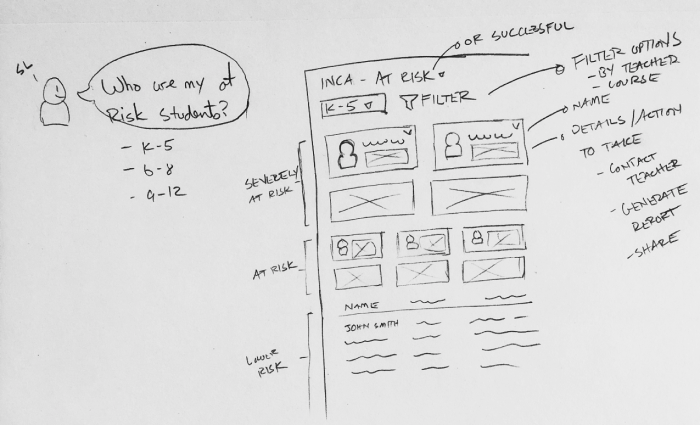
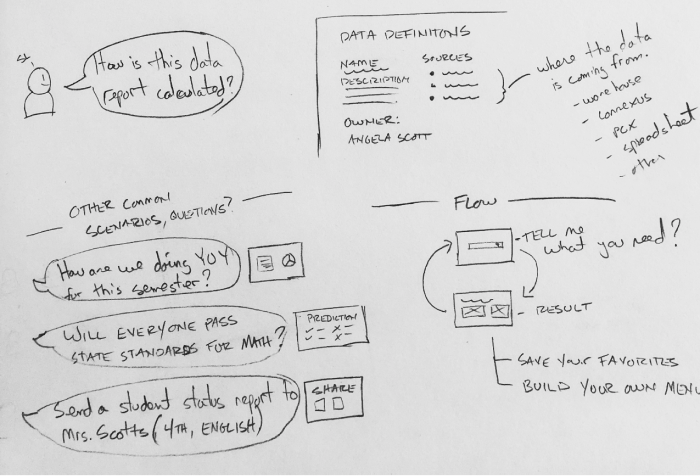
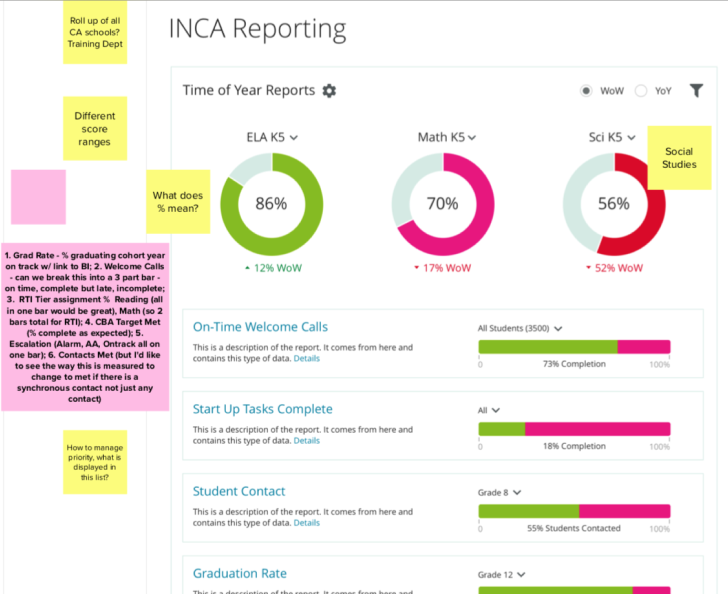
We posted all our solution wireframes within a MURAL board and reviewed each one while asking clarifying questions. I sketched the following solution during our design workshop.
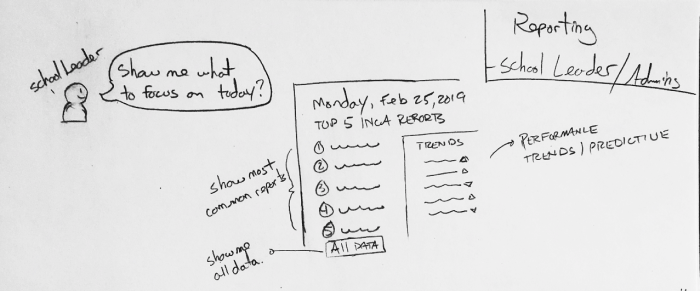
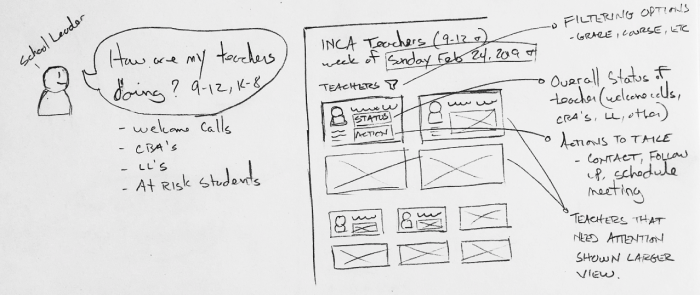
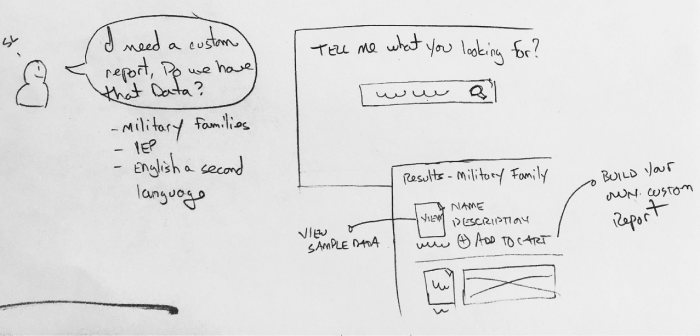
After the team walked through each sketch solution, we voted on the interesting portions of each participants design. Then, I was responsible for taking the design to a higher fidelity (Sketch) and creating a prototype (InVision) for school leader feedback.
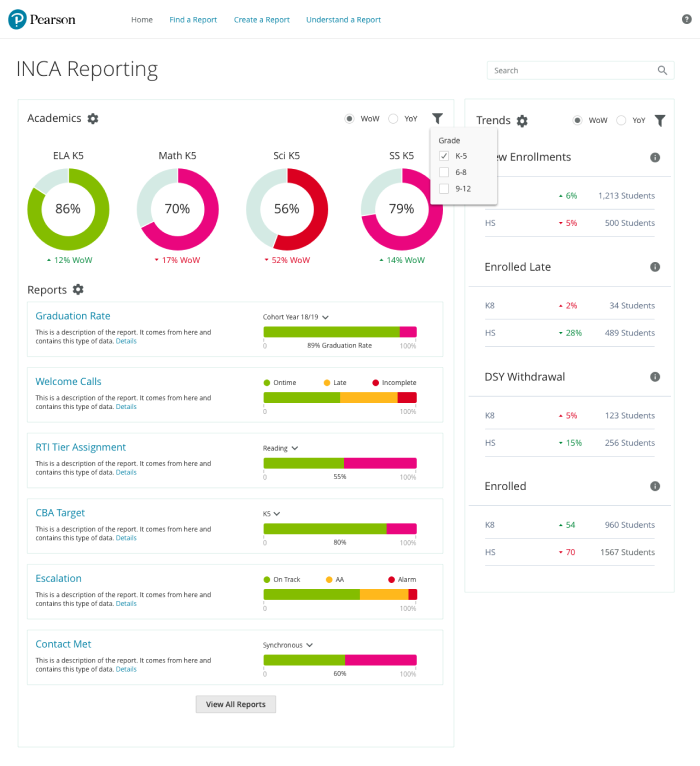
Using the high fidelity prototype, we presented the solution to school leaders to get their feedback. During the feedback session, we were able to identify areas of the design that needed further refinement.
School leaders wanted more filtering options, clear data visualizations, and re-prioritize the reports that matter to them.
Development teams picked up the work during PI Planning and started developing a data warehouse from the provided designs. Finally, product teams decided to use our internal Power BI group to display the reports.
Unfortunately, the organization underwent a significant product shift that prevented the project from being fully implemented for schools.
However, product leadership recognized the value in the design discovery process used for this project as a case study for future initiatives.
If you have a role or opportunity that sounds like a good fit, I'd love to hear from you. — Chris